背景
在树形递归查询这篇文章,我记录了使用CTE语法查询树形结构的办法。在一个树形结构中,每一个节点最多有一个上级,可以有任意个数的下级。
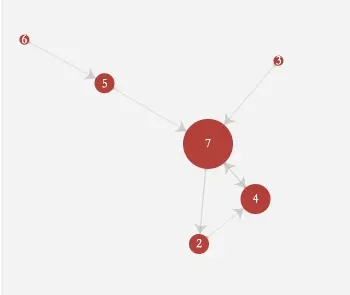
在实际场景中,我们还会遇到对图(graph)的查询,图和树的最大区别是,图的节点可以有任意个数的上级和下级。如下图所示

因为图可能存在loop结构(上图红色箭头),所以在使用CTE递归的过程中,必须要破环(break loop),否则算法就会进入无限递归,永不结束。
存储和查询图结构,目前当红数据库是neo4j,但是当数据量只有十几万条的时候,PostgreSQL完全可以胜任。
构造样本数据
-- 每一条有向关系边都存在上游,下游两个节点
drop table if exists demo.t_rel;
create table if not exists demo.t_rel(up int , down int);

-- 唯一约束,避免插入相同的关系
alter table demo.t_rel add constraint udx_t_rel unique (up, down);

insert into demo.t_rel values(6,5),(3,7),(5,1),(1,2),(5,2),(5,7),(7,2),(2,4),(7,4);

-- 构造一条环数据,7-2-4-7
delete from demo.t_rel where up=4 and down=7;
insert into demo.t_rel values(4,7);
递归查询
指定节点的下级
常见的一个场景是,给定一个节点,查询这个节点的所有下级节点和路径。使用破环的算法关键如下
- 使用数组保存当前的路径信息。
- 计算下一个节点之前,判断该节点是否已经存在于路径上。如果是,就说明该点是环的起点,必须排除这个节点来达到破环的效果。
- 起始节点和最大深度,都是可选的。如果忽略这两个条件,就会返回完整的图信息。
with recursive
downstream as
(
	select 1 as lvl, r.up, r.down,
			-- 保存当前路径
			array[]::int[] || r.up || r.down as trace
		from demo.t_rel r
	where r.up = 7 -- 指定起点
	union all
	select ds.lvl +1, r.up, r.down, ds.trace || r.down
		from demo.t_rel r , downstream ds
	where r.up = ds.down
		-- 破环
		and not r.down = any(ds.trace)
		and ds.lvl  20 -- 最大深度
)
select * from downstream ds;
上面以节点7为开始,返回下级的所有节点和路径信息,如下。
-- 可以看到并没有包括7-2-4-7这条环。
 lvl | up | down | trace
-----+----+------+---------
 1 | 7 | 2 | {7,2}
 1 | 7 | 4 | {7,4}
 2 | 2 | 4 | {7,2,4}
(3 rows)
指定节点的所有关联
在社交网络的场景中,我们根据一个特定的节点,查询所有的关系网。在本文的样本数据中,我们的需求就变成,同时查询指定节点的所有上级和下级。
为了方便后面的测试,我们封装一个函数
drop function if exists f_get_rel;

/*
取得某个节点的相关联节点,和路径信息。
@start_node 起始节点。
@direct_flag 查询方向,-1:查找上级;1:查找下级; 0:查找上下级;
@max_depth 递归深度,即查找最多几级关系。
*/
create or replace function f_get_rel(start_node int, direct_flag int=1, max_depth int=20)
	returns table (direct int, cur_depth int, up_node int, down_node int, trace int[])
as $$
begin

	return query
		with recursive
		downstream as
		(
			select 1 as lvl, r.up, r.down, array[]::int[] || r.up || r.down as trace
				from demo.t_rel r
			where r.up = start_node
				and direct_flag in (0, 1)
			union all
			select ds.lvl +1, r.up, r.down, ds.trace || r.down
				from demo.t_rel r , downstream ds
			where r.up = ds.down
				and not r.down = any(ds.trace)
				and ds.lvl  max_depth
		),
		upstream as
		(
			select 1 as lvl, r.up, r.down, array[]::int[] || r.up || r.down as trace
				from demo.t_rel r
			where r.down = start_node
				and direct_flag in (0, -1)
			union all
			select us.lvl +1, r.up, r.down, r.up || us.trace
				from demo.t_rel r , upstream us
			where r.down = us.up
				and not r.up = any(us.trace)
				and us.lvl  max_depth
		)
		select -1, us.* from upstream us
			union all
		select 1, ds.* from downstream ds
		order by 1 desc, lvl, up, down
	;

end;
$$ language plpgsql strict;
测试一下,查询节点7的所有3度关联节点信息,如下
dap=# select * from demo.f_get_rel(7,0,3);
 direct | cur_depth | up_node | down_node | trace
--------+-----------+---------+-----------+-----------
  1 |   1 |  7 |   2 | {7,2}
  1 |   1 |  7 |   4 | {7,4}
  1 |   2 |  2 |   4 | {7,2,4}
  -1 |   1 |  3 |   7 | {3,7}
  -1 |   1 |  4 |   7 | {4,7}
  -1 |   1 |  5 |   7 | {5,7}
  -1 |   2 |  2 |   4 | {2,4,7}
  -1 |   2 |  6 |   5 | {6,5,7}
  -1 |   3 |  1 |   2 | {1,2,4,7}
  -1 |   3 |  5 |   2 | {5,2,4,7}
(10 rows)
图形显示结果
ECharts模板
在没有集成图形界面之前,使用ECharts的示例代码(地址),可以直观的查看关系图谱。对官方样表进行微调之后,代码如下
注意 代码中的 data 和 links 部分需要进行替换
option = {
 title: {
  text: '数据图谱'
 },
 tooltip: {},
 animationDurationUpdate: 1500,
 animationEasingUpdate: 'quinticInOut',
 series : [
  {
   type: 'graph',
   layout: 'force',
   force: {
     repulsion: 1000
    },
   focusNodeAdjacency: true,
   symbolSize: 30,
   roam: true,
   label: {
    normal: {
     show: true
    }
   },
   edgeSymbol: ['circle', 'arrow'],
   edgeSymbolSize: [4, 10],
   edgeLabel: {
    normal: {
     textStyle: {
      fontSize: 20
     }
    }
   },
   data: [
    { name:"2", draggable: true, symbolSize:20},
   ],
   links: [
    { source:"2", target:"4"},
   ],

  }
 ]
};
造显示用数据
构造 data 部分
-- 根据节点的关联点数量,设置图形大小
with rel as (select * from f_get_rel(7,0,2)),
	up_nodes as (select up_node, count(distinct down_node) as out_cnt from rel group by up_node),
	down_nodes as (select down_node, count(distinct up_node) as in_cnt from rel group by down_node),
	node_cnt as ( select up_node as node, out_cnt as cnt from up_nodes union all select * from down_nodes )
select '{ name:"' || n.node || '", draggable: true, symbolSize:' || sum(n.cnt) * 10 || '},' as node
	from node_cnt n
group by n.node
order by 1;
构造 links 部分
select distinct r.up_node, r.down_node, '{ source:"'|| r.up_node ||'", target:"'|| r.down_node ||'"},' as links
	from f_get_rel(7,0,3) r
order by r.up_node	;
图形显示
把构造的data和links替换到ECharts代码里面
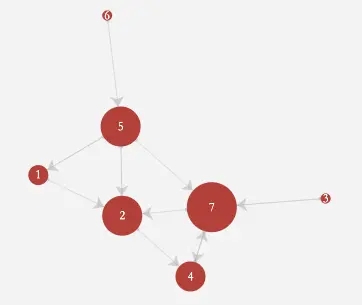
查询节点7的所有2度关联节点信息,结果显示如下
查询节点7的所有关联节点信息(不限层级数),结果显示如下
总结
以上就是这篇文章的全部内容了,希望本文的内容对大家的学习或者工作具有一定的参考学习价值,谢谢大家对脚本之家的支持。
您可能感兴趣的文章:- PostgreSQL树形结构的递归查询示例
- 在PostgreSQL中实现递归查询的教程
- PostgreSQL利用递归优化求稀疏列唯一值的方法