多边形选区概述
多边形选区是一种常见的对象选择方式,在一个子图中,单击鼠标左键即构建一个多边形的端点,最后一个端点与第一个端点重合即完成多边形选区,选区即为多个端点构成的多边形。在matplotlib中的多边形选区属于部件(widgets),matplotlib中的部件都是中性(neutral )的,即与具体后端实现无关。
多边形选区具体实现定义为matplotlib.widgets.PolygonSelector类,继承关系为:Widget->AxesWidget->_SelectorWidget->PolygonSelector。
PolygonSelector类的签名为class matplotlib.widgets.PolygonSelector(ax, onselect, useblit=False, lineprops=None, markerprops=None, vertex_select_radius=15)
PolygonSelector类构造函数的参数为:
- ax:多边形选区生效的子图,类型为matplotlib.axes.Axes的实例。
- onselect:多边形选区完成后执行的回调函数,函数签名为def onselect( vertices),vertices数据类型为列表,列表元素格式为(xdata,ydata)元组。
- drawtype:多边形选区的外观,取值范围为{"box", "line", "none"},"box"为多边形框,"line"为多边形选区对角线,"none"无外观,类型为字符串,默认值为"box"。
- lineprops:多边形选区线条的属性,默认值为dict(color='k', linestyle='-', linewidth=2, alpha=0.5)。
- markerprops:多边形选区端点的属性,默认值为dict(marker='o', markersize=7, mec='k', mfc='k', alpha=0.5)。
- vertex_select_radius:多边形端点的选择半径,浮点数,默认值为15,用于端点选择或者多边形闭合。
PolygonSelector类中的state_modifier_keys公有变量 state_modifier_keys定义了操作快捷键,类型为字典。
- “move_all”: 移动已存在的选区,默认为"shift"。
- “clear”:清除现有选区,默认为 "escape",即esc键。
- “move_vertex”:正方形选区,默认为"control"。
PolygonSelector类中的verts特性返回多边形选区中的多有端点,类型为列表,元素为(x,y)元组,即端点的坐标元组。
案例
官方案例,https://matplotlib.org/gallery/widgets/polygon_selector_demo.html
案例说明
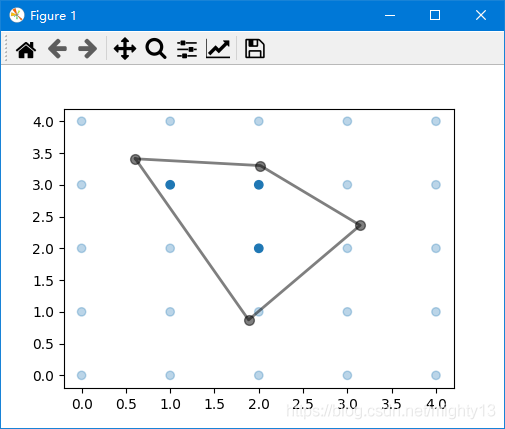
单击鼠标左键创建端点,最终点击初始端点闭合多边形,形成多边形选区。选区外的数据元素颜色变淡,选区内数据颜色保持不变。
按esc键取消选区。按shift键鼠标可以移动多边形选区位置,按ctrl键鼠标可以移动多边形选区某个端点的位置。退出程序时,控制台输出选区内数据元素的坐标。
控制台输出:
Selected points:
[[2.0 2.0]
[1.0 3.0]
[2.0 3.0]]
案例代码
import numpy as np

from matplotlib.widgets import PolygonSelector
from matplotlib.path import Path


class SelectFromCollection:
  """
  Select indices from a matplotlib collection using `PolygonSelector`.

  Selected indices are saved in the `ind` attribute. This tool fades out the
  points that are not part of the selection (i.e., reduces their alpha
  values). If your collection has alpha  1, this tool will permanently
  alter the alpha values.

  Note that this tool selects collection objects based on their *origins*
  (i.e., `offsets`).

  Parameters
  ----------
  ax : `~matplotlib.axes.Axes`
    Axes to interact with.
  collection : `matplotlib.collections.Collection` subclass
    Collection you want to select from.
  alpha_other : 0 = float = 1
    To highlight a selection, this tool sets all selected points to an
    alpha value of 1 and non-selected points to *alpha_other*.
  """

  def __init__(self, ax, collection, alpha_other=0.3):
    self.canvas = ax.figure.canvas
    self.collection = collection
    self.alpha_other = alpha_other

    self.xys = collection.get_offsets()
    self.Npts = len(self.xys)

    # Ensure that we have separate colors for each object
    self.fc = collection.get_facecolors()
    if len(self.fc) == 0:
      raise ValueError('Collection must have a facecolor')
    elif len(self.fc) == 1:
      self.fc = np.tile(self.fc, (self.Npts, 1))

    self.poly = PolygonSelector(ax, self.onselect)
    self.ind = []

  def onselect(self, verts):
    path = Path(verts)
    self.ind = np.nonzero(path.contains_points(self.xys))[0]
    self.fc[:, -1] = self.alpha_other
    self.fc[self.ind, -1] = 1
    self.collection.set_facecolors(self.fc)
    self.canvas.draw_idle()

  def disconnect(self):
    self.poly.disconnect_events()
    self.fc[:, -1] = 1
    self.collection.set_facecolors(self.fc)
    self.canvas.draw_idle()


if __name__ == '__main__':
  import matplotlib.pyplot as plt

  fig, ax = plt.subplots()
  grid_size = 5
  grid_x = np.tile(np.arange(grid_size), grid_size)
  grid_y = np.repeat(np.arange(grid_size), grid_size)
  pts = ax.scatter(grid_x, grid_y)

  selector = SelectFromCollection(ax, pts)

  print("Select points in the figure by enclosing them within a polygon.")
  print("Press the 'esc' key to start a new polygon.")
  print("Try holding the 'shift' key to move all of the vertices.")
  print("Try holding the 'ctrl' key to move a single vertex.")

  plt.show()

  selector.disconnect()

  # After figure is closed print the coordinates of the selected points
  print('\nSelected points:')
  print(selector.xys[selector.ind])
到此这篇关于matplotlib之多边形选区(PolygonSelector)的使用的文章就介绍到这了,更多相关matplotlib 多边形选区内容请搜索脚本之家以前的文章或继续浏览下面的相关文章希望大家以后多多支持脚本之家!
您可能感兴趣的文章:- 详解Golang并发操作中常见的死锁情形
- Go 语言中的死锁问题解决
- Go语言死锁与goroutine泄露问题的解决
- golang coroutine 的等待与死锁用法
- go select编译期的优化处理逻辑使用场景分析
- Django实现jquery select2带搜索的下拉框
- Go语言使用select{}阻塞main函数介绍
- golang中的select关键字用法总结
- Go select 死锁的一个细节