目录
- 1. 下载grafana并安装
- 2. 开启grafana服务
- 3. 浏览器访问并配置
1. 下载grafana并安装
1.1 官网下载较慢,在清华镜像站下载
下载链接>> https://mirrors.tuna.tsinghua.edu.cn/grafana/yum/rpm/
1.2 下载之后上传
上传之后查看
[root@localhost ~]# ls
grafana-7.3.3-1.x86_64.rpm
1.3 yum安装解决依赖关系
yum -y install grafana-7.3.3-1.x86_64.rpm
2. 开启grafana服务
2.1 开启服务
systemctl start grafana-server
2.2 查看端口验证(grafana默认监听3000端口)
[root@localhost ~]# netstat -nlpt|grep 3000
tcp6  0  0 :::3000     :::*     LISTEN  21185/grafana-serve
3. 浏览器访问并配置
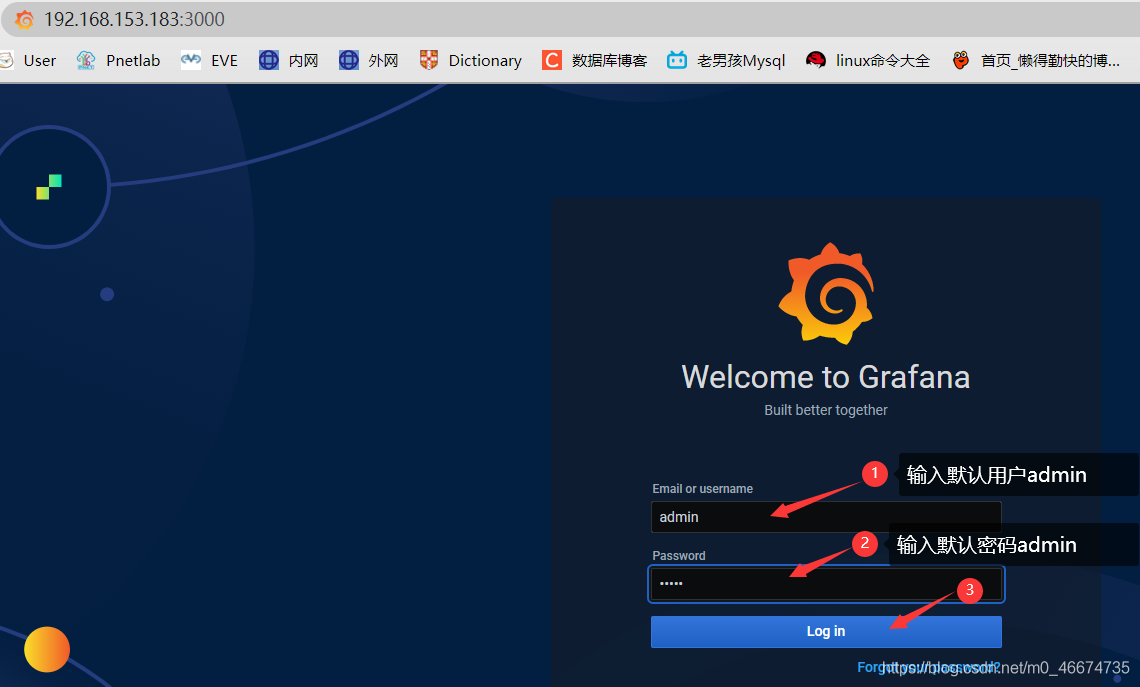
3.1 打开浏览器输入 IP:3000 访问
例如: 192.168.153.183:3000
3.2 访问成功之后输入默认的用户名和密码登录
默认的用户名和密码均为:admin
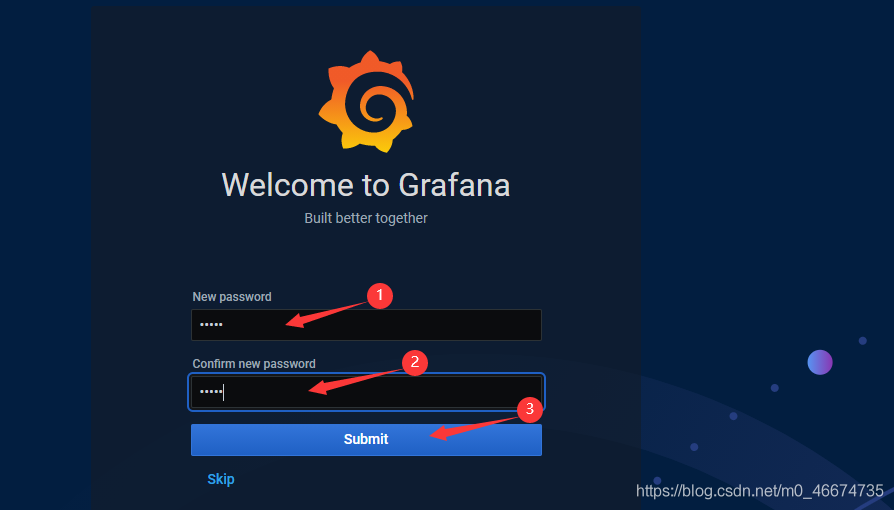
3.3 登陆成功之后配置新的密码
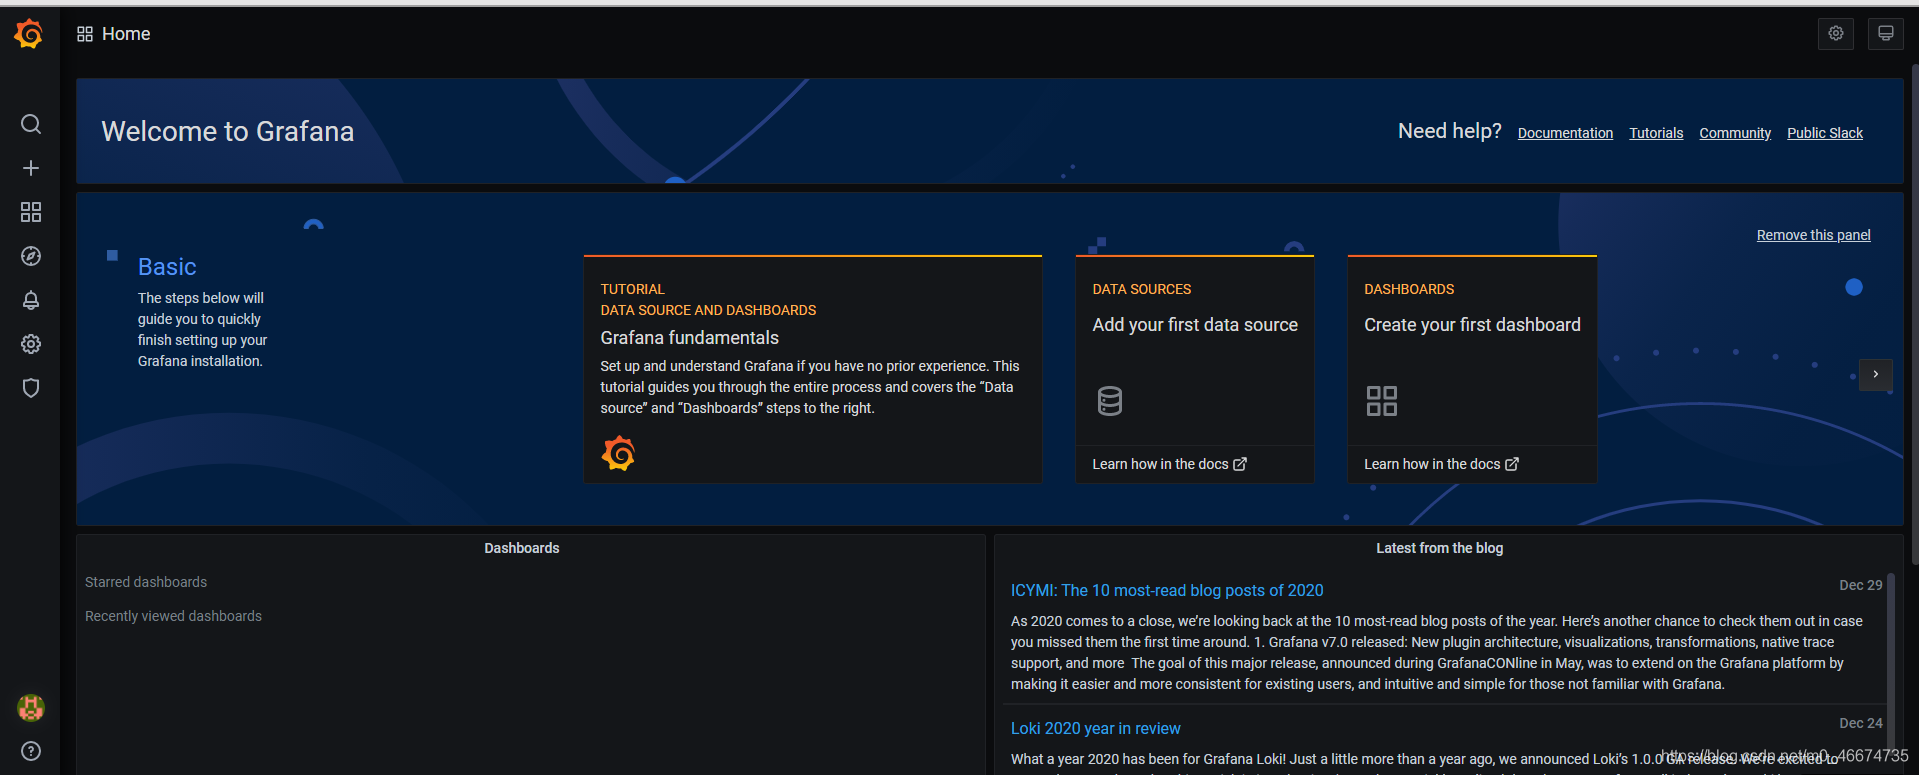
3.4 成功访问grafana主页
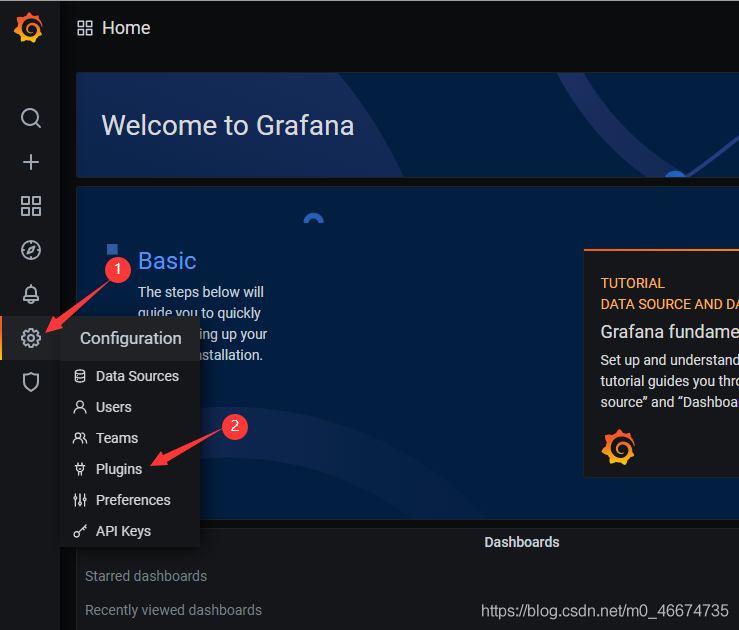
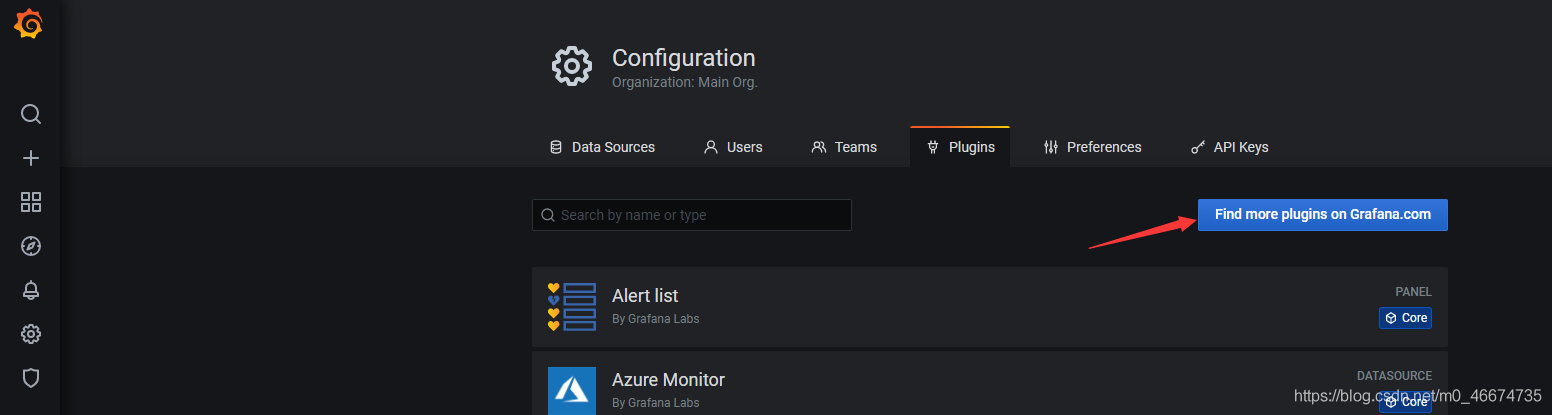
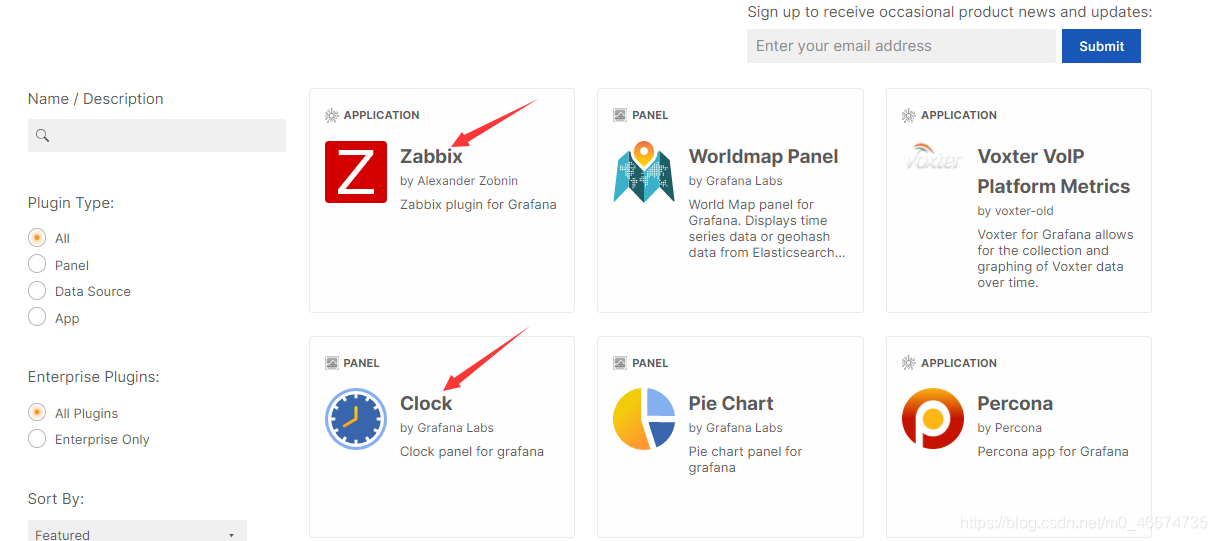
3.5 添加zabbix插件和clock插件
grafana 默认插件的存放位置为:/var/lib/grafana/plugins
1)
2)
3)
4)
5)
6)在服务器安装
[root@localhost ~]# cd /var/lib/grafana/plugins/
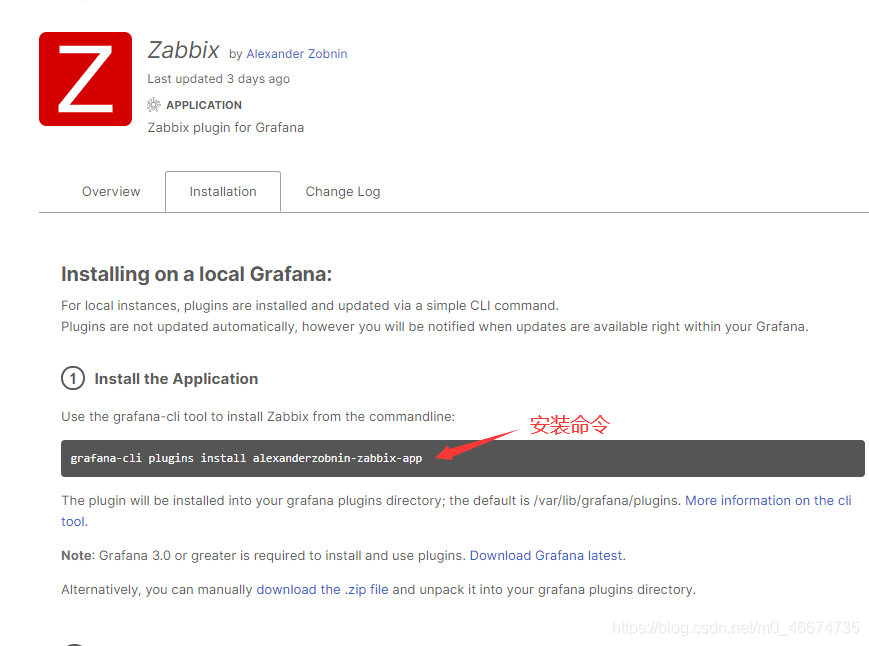
安装zabbix创建
[root@localhost plugins]# grafana-cli plugins install alexanderzobnin-zabbix-app
installing alexanderzobnin-zabbix-app @ 4.1.1
from: https://grafana.com/api/plugins/alexanderzobnin-zabbix-app/versions/4.1.1/download
into: /var/lib/grafana/plugins
✔ Installed alexanderzobnin-zabbix-app successfully
Restart grafana after installing plugins . service grafana-server restart>
[root@localhost plugins]#
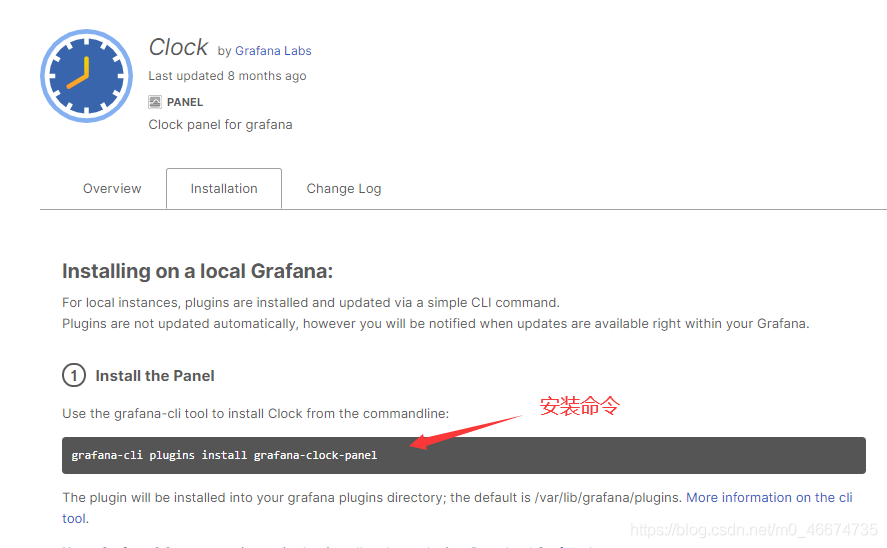
安装clock插件
[root@localhost plugins]# grafana-cli plugins install grafana-clock-panel
installing grafana-clock-panel @ 1.1.1
from: https://grafana.com/api/plugins/grafana-clock-panel/versions/1.1.1/download
into: /var/lib/grafana/plugins
✔ Installed grafana-clock-panel successfully
Restart grafana after installing plugins . service grafana-server restart>
[root@localhost plugins]#
安装之后查看
[root@localhost plugins]# ls
alexanderzobnin-zabbix-app grafana-clock-panel
6)重启grafana服务
systemctl restart grafana-server
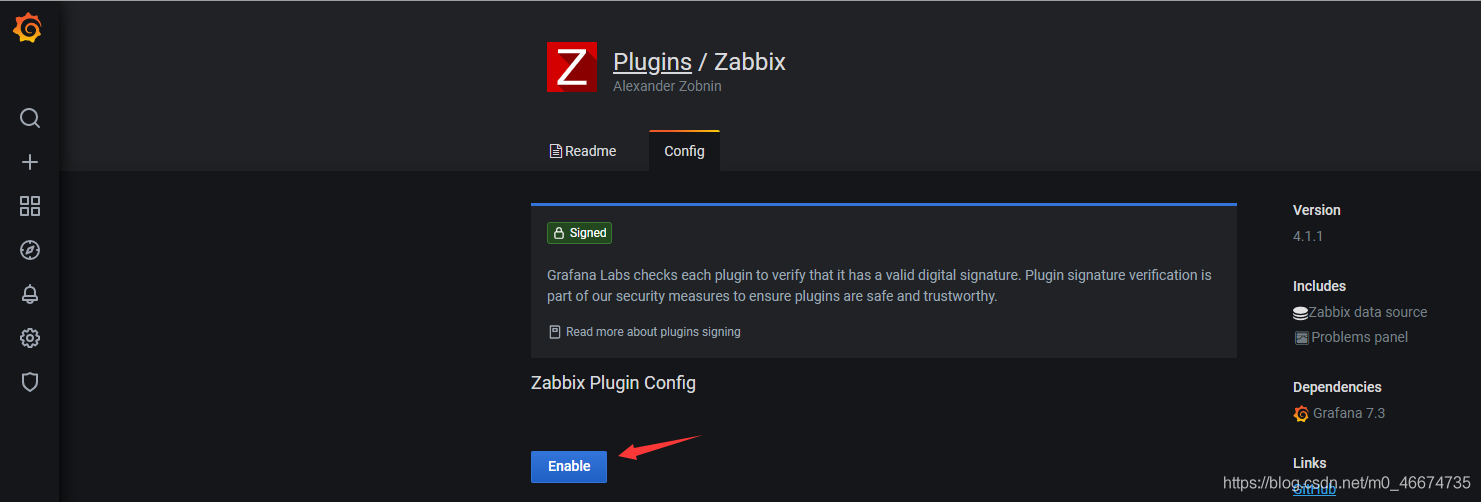
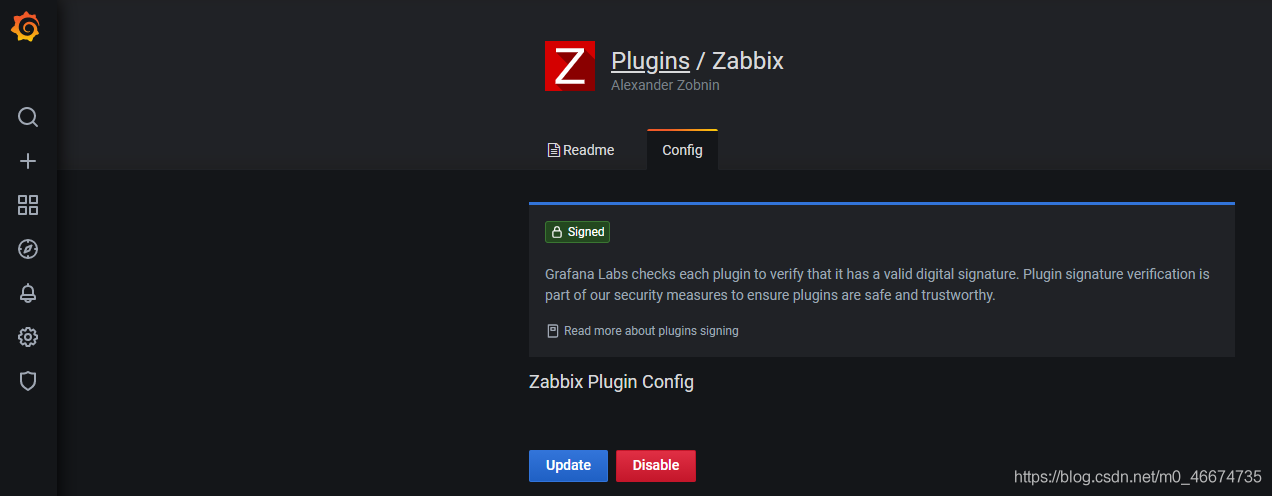
7)
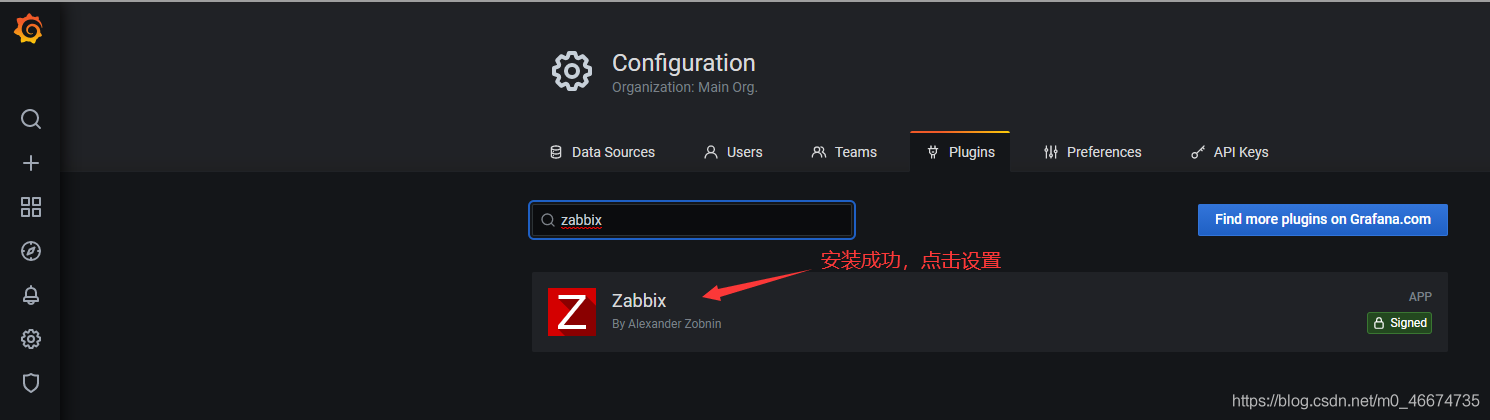
8)使能 zabbix(clock插件安装之后直接可以使用,无需设置)
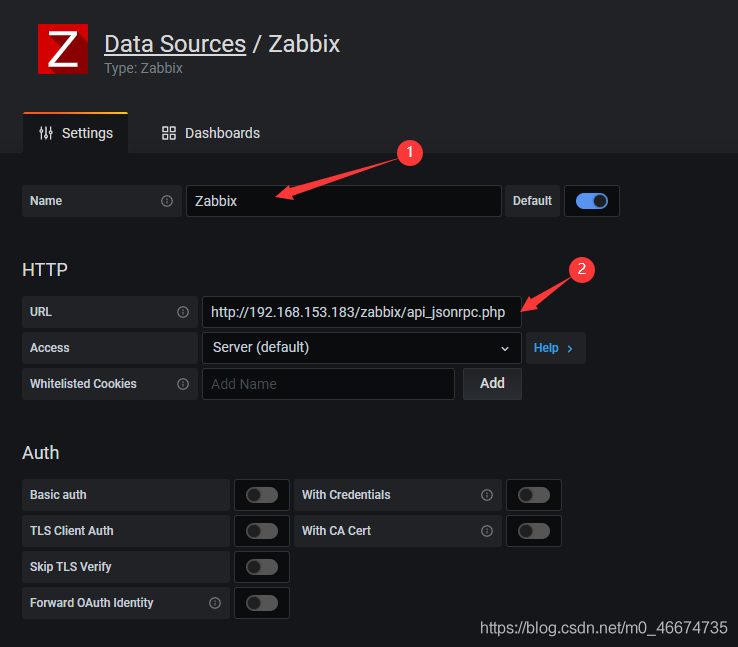
3.6 添加zabbix数据源
1)
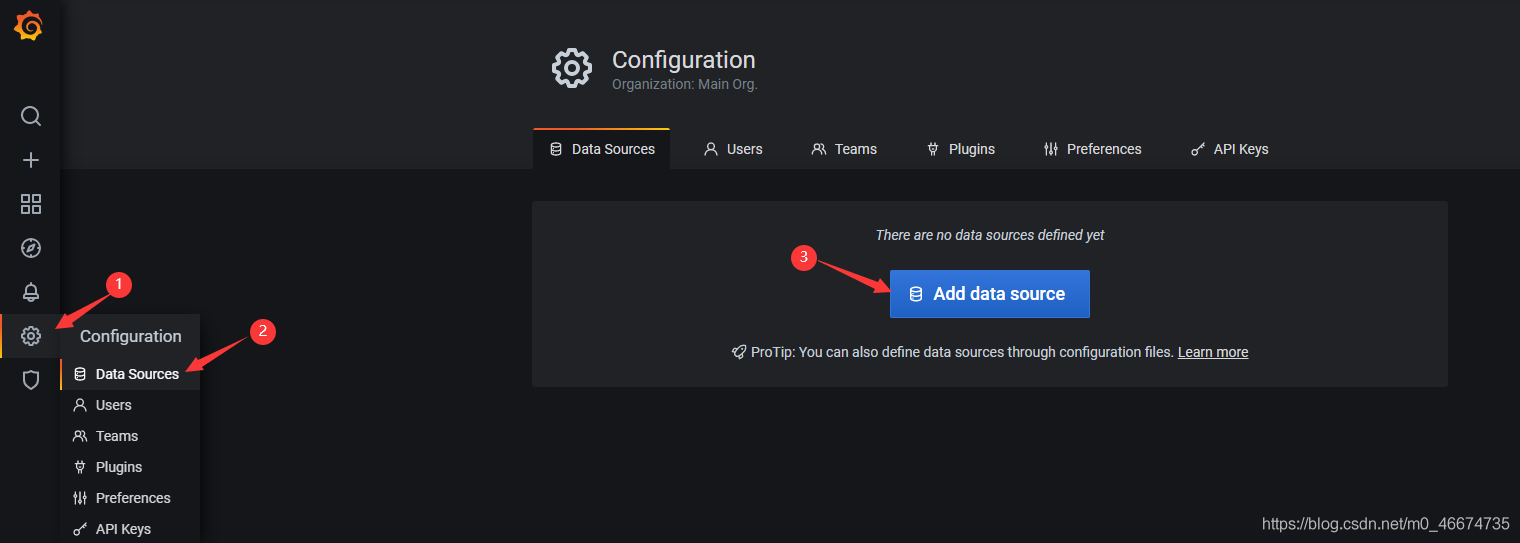
2)
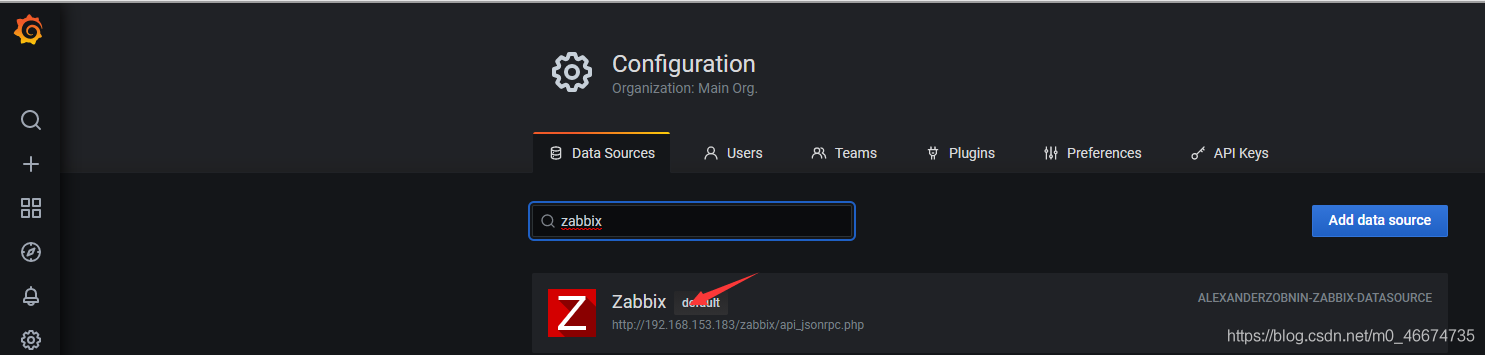
3)
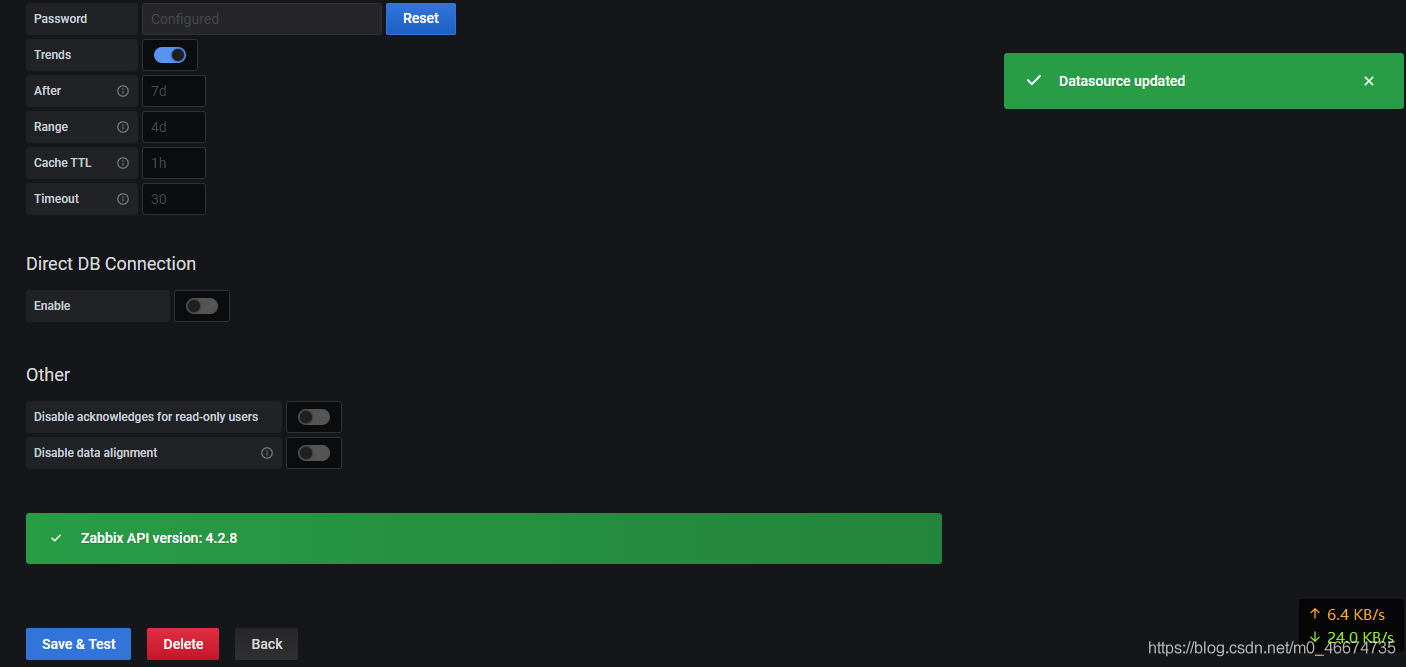
4)输入连接zabbix接口的用户名和密码,用户名为admin,密码为 zabbix
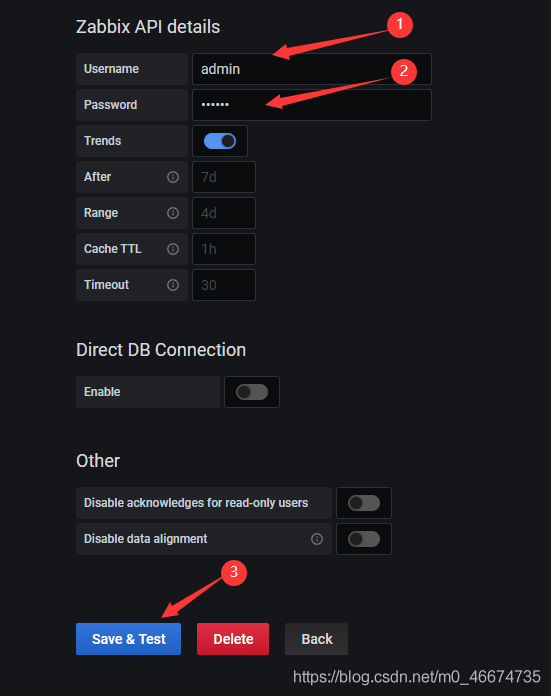
5)测试成功
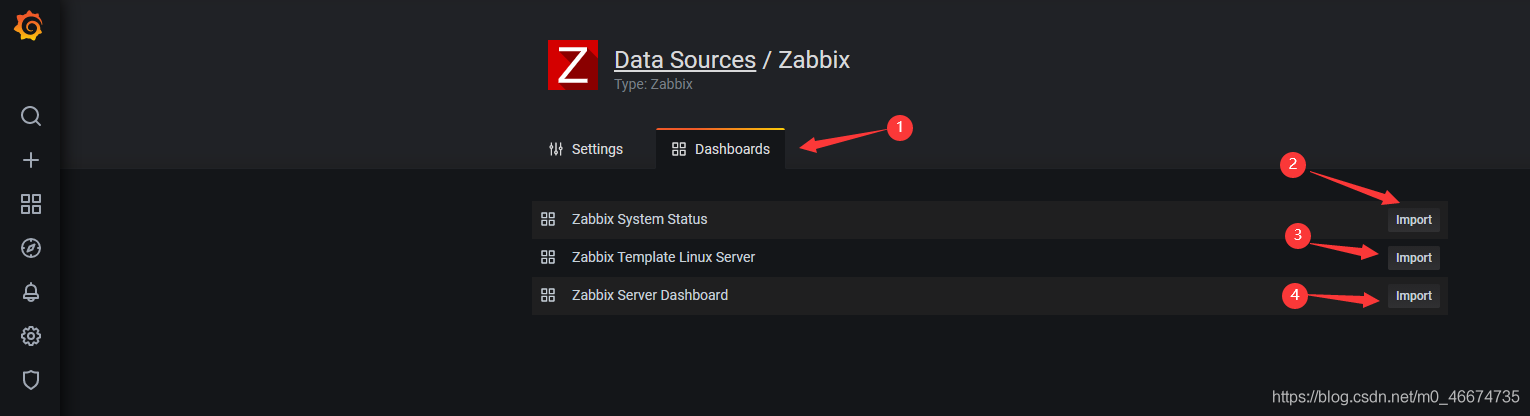
6)导入仪表板
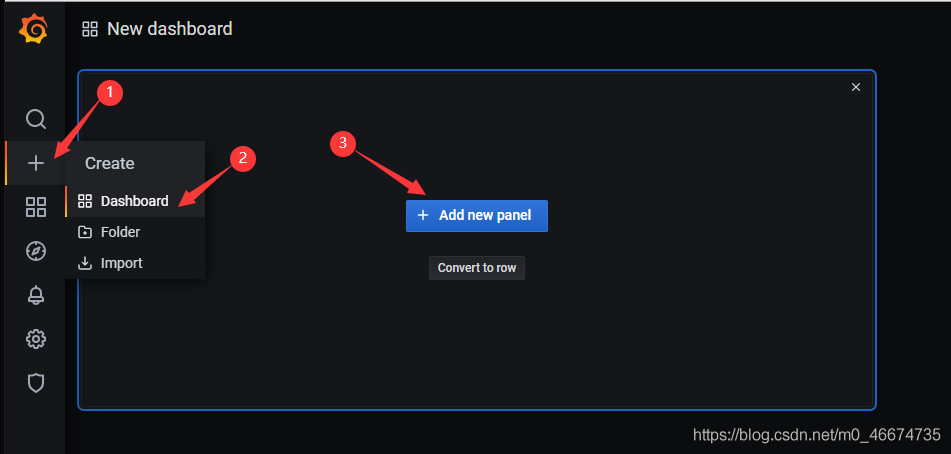
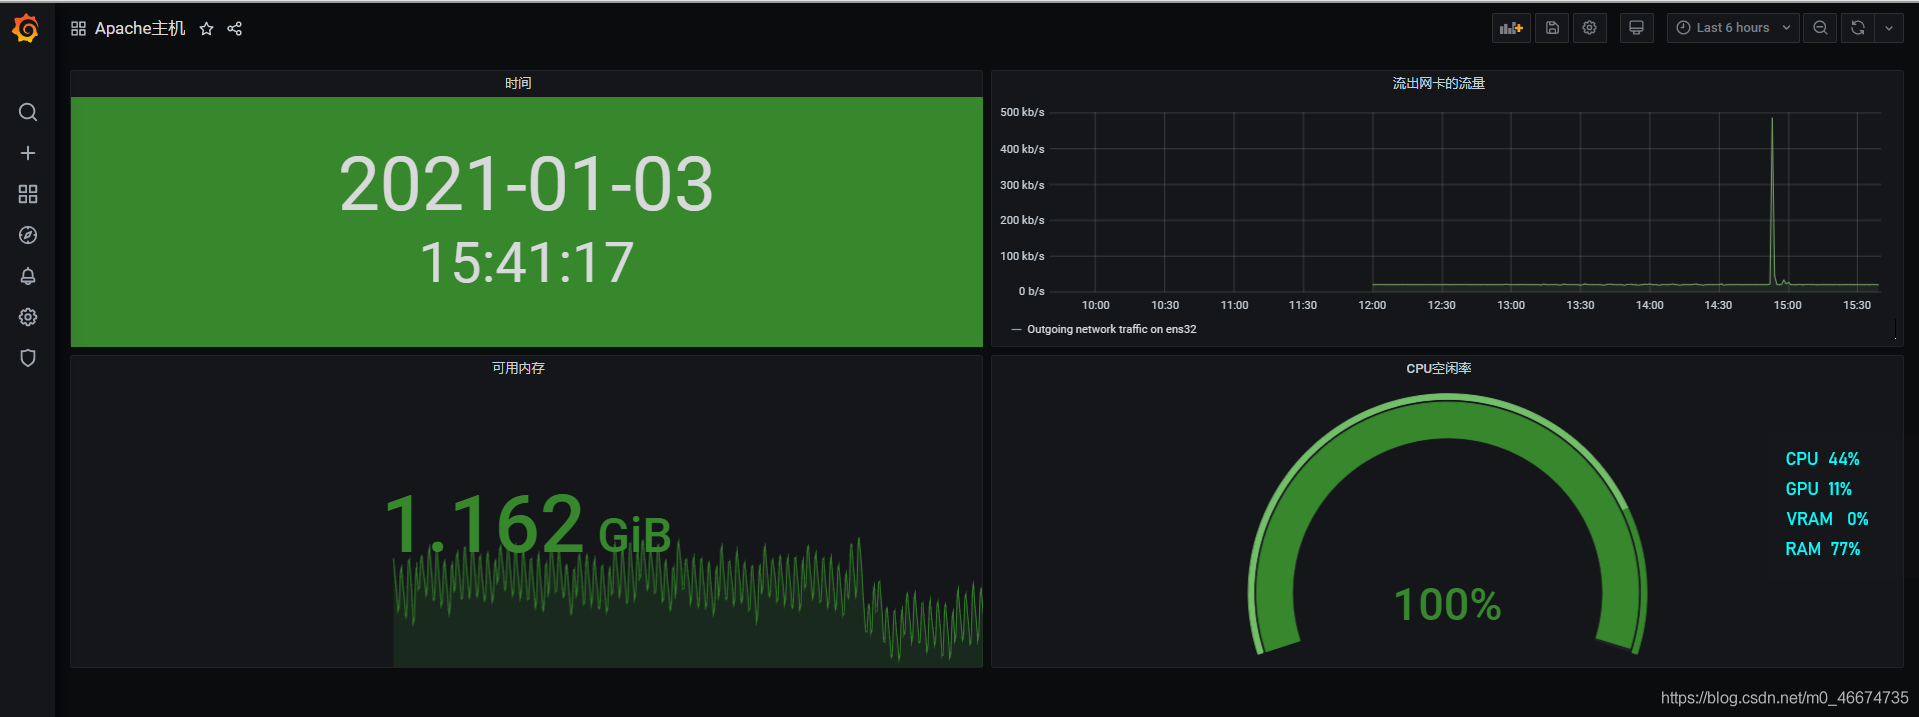
3.7 创建新的仪表板
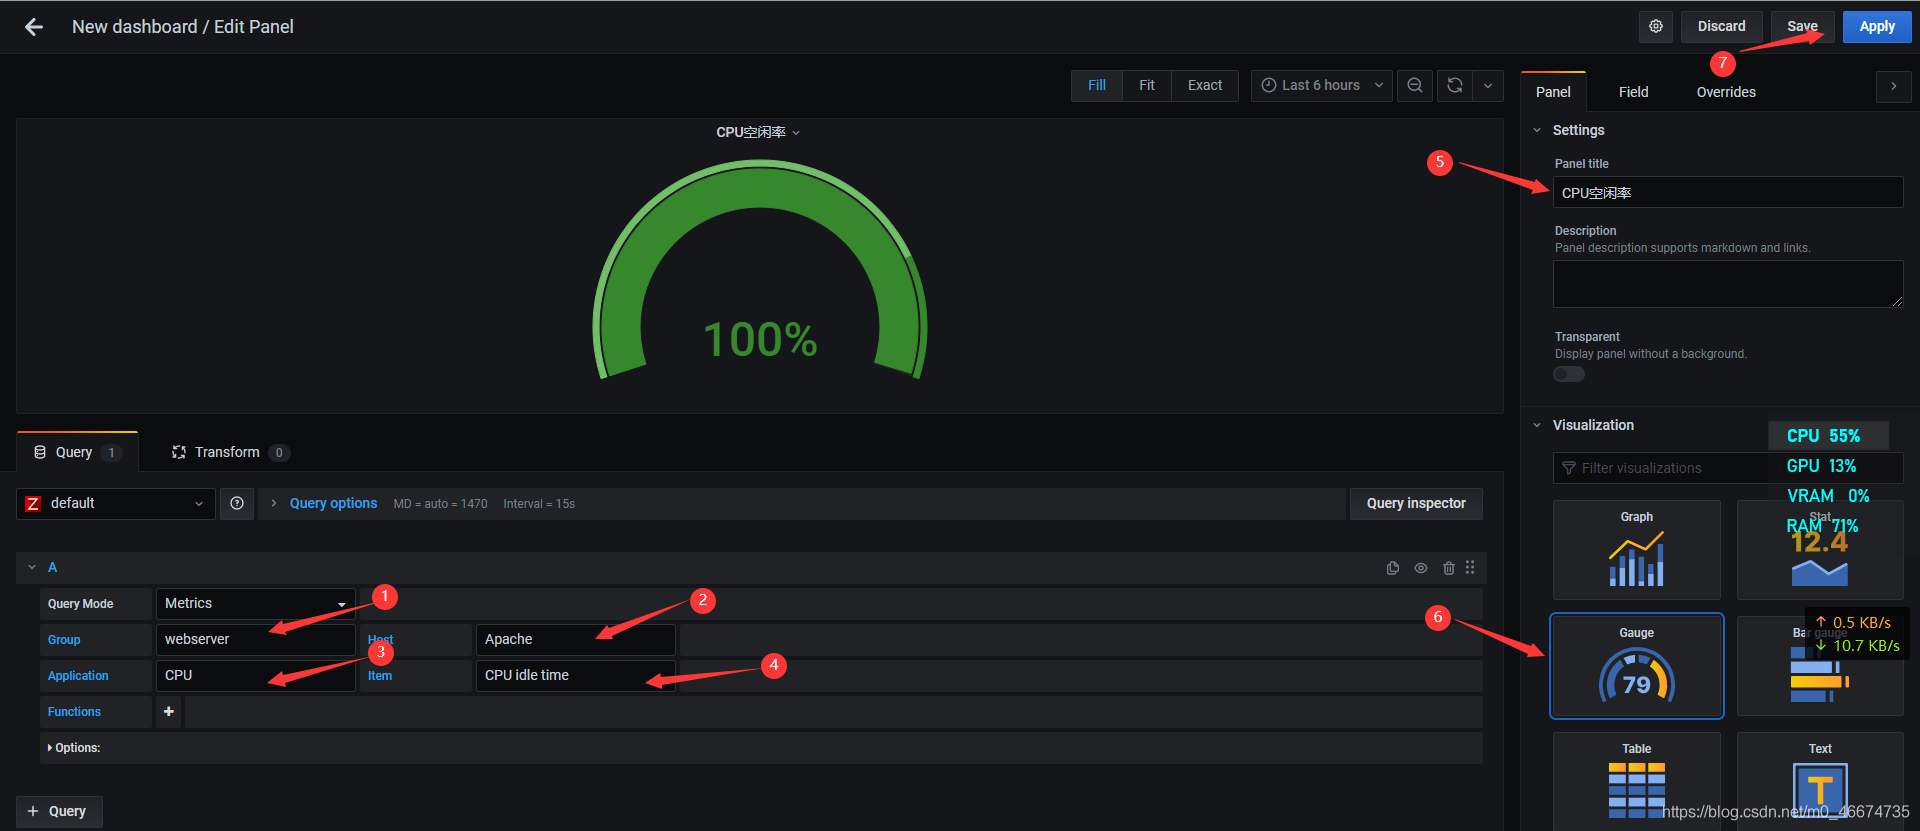
3.8 创建CPU空闲率仪表板
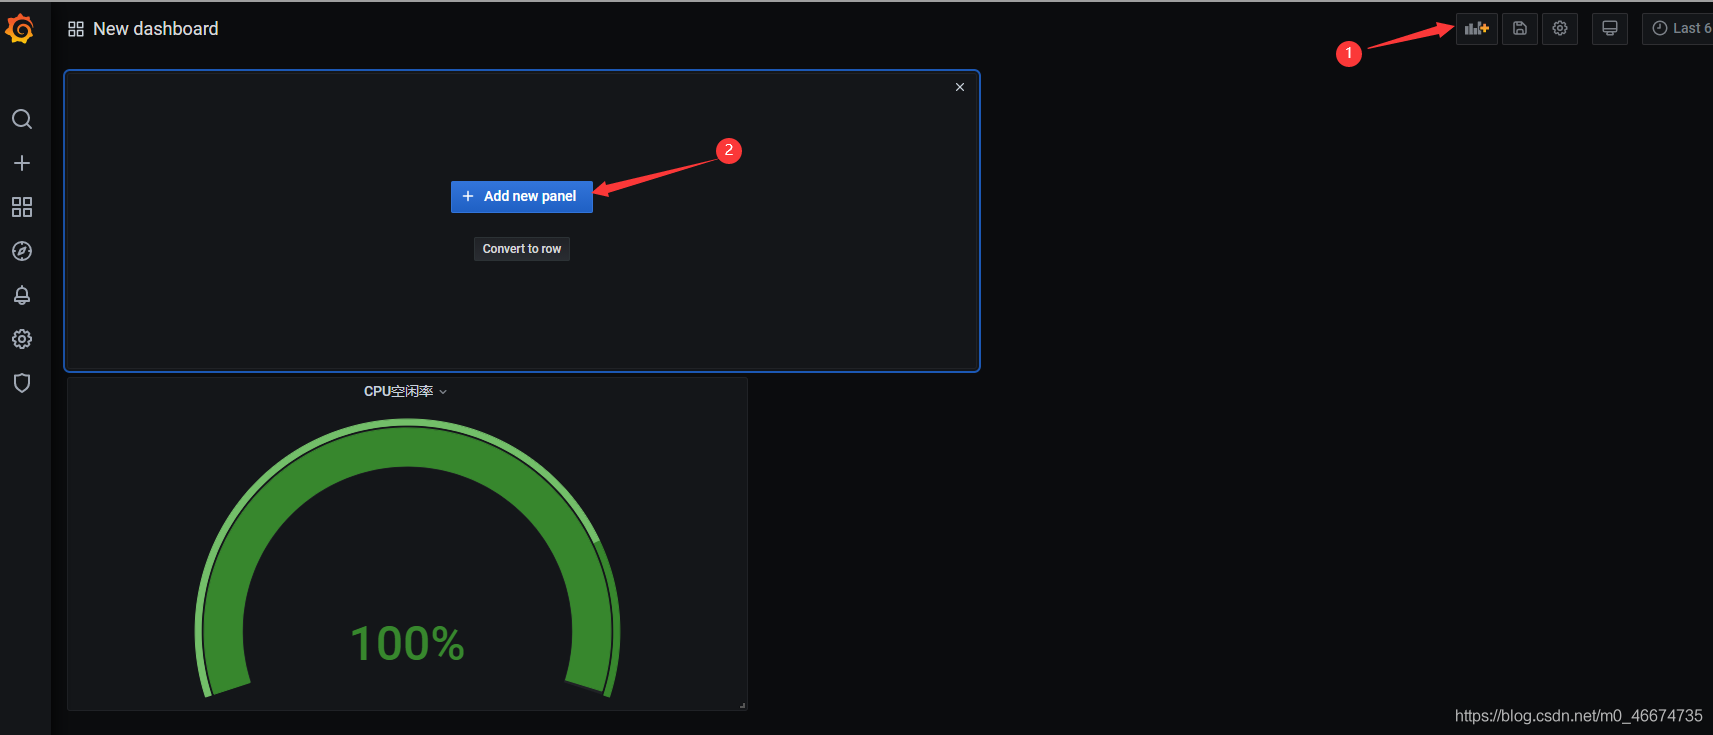
3.9 添加仪表板
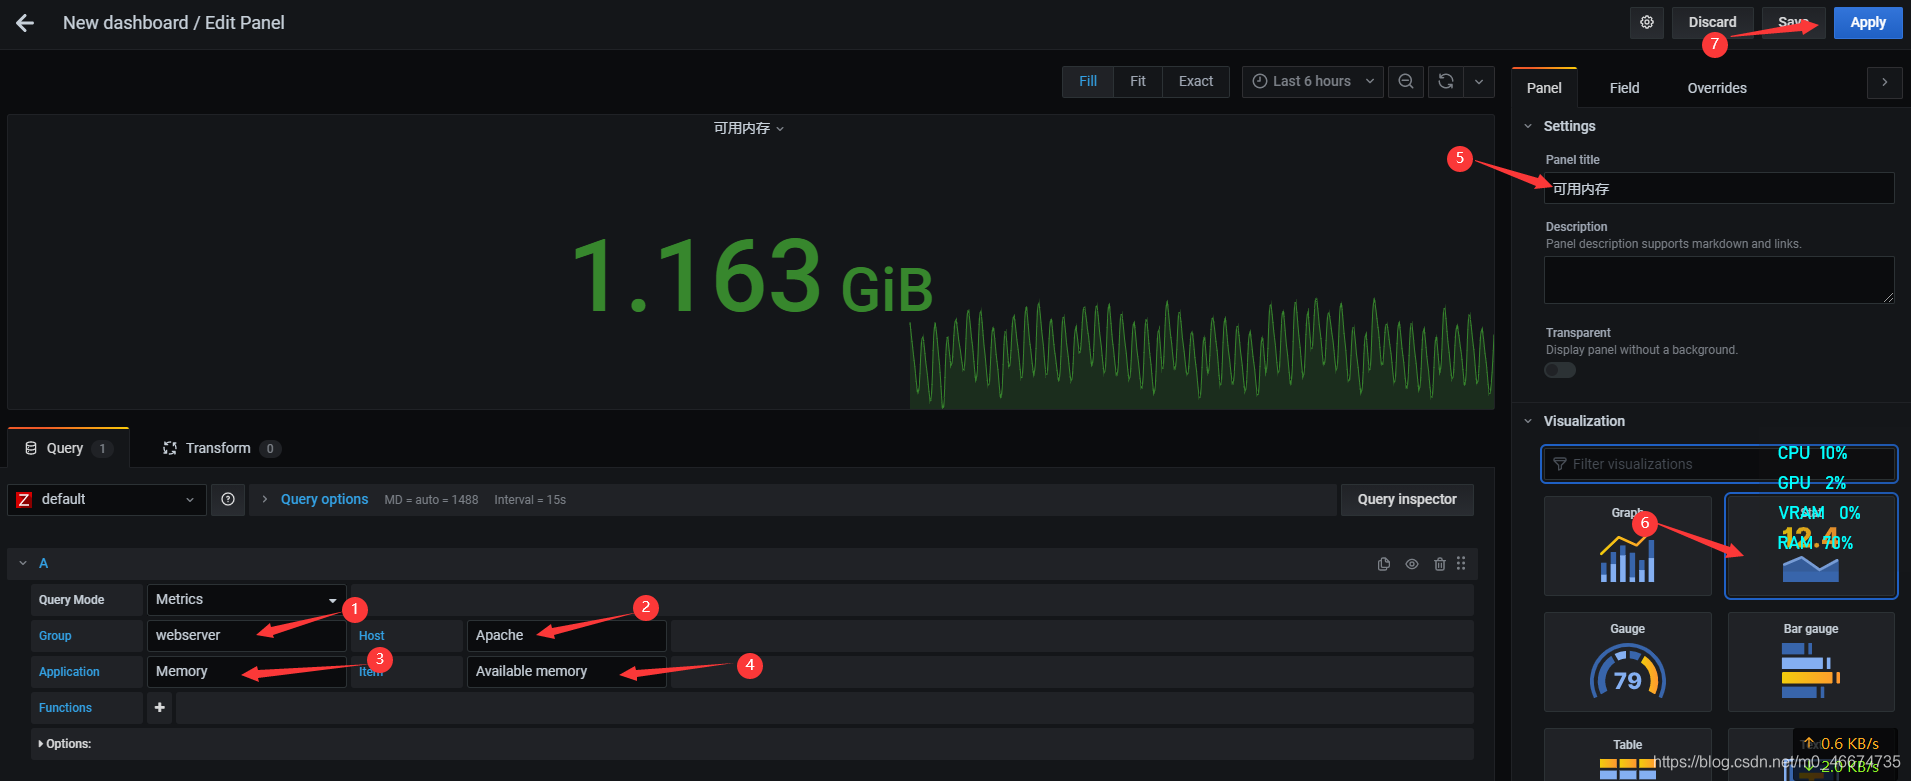
3.9 添加可用内存仪表板
3.10 添加时间仪表板
1)
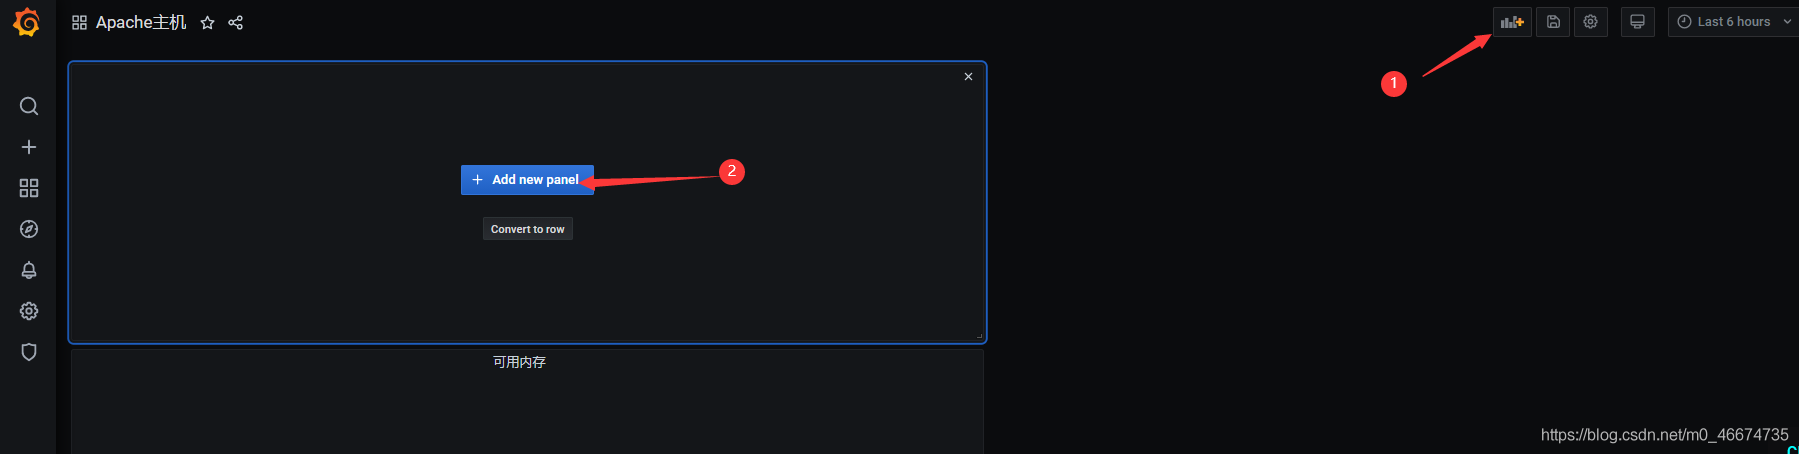
2)
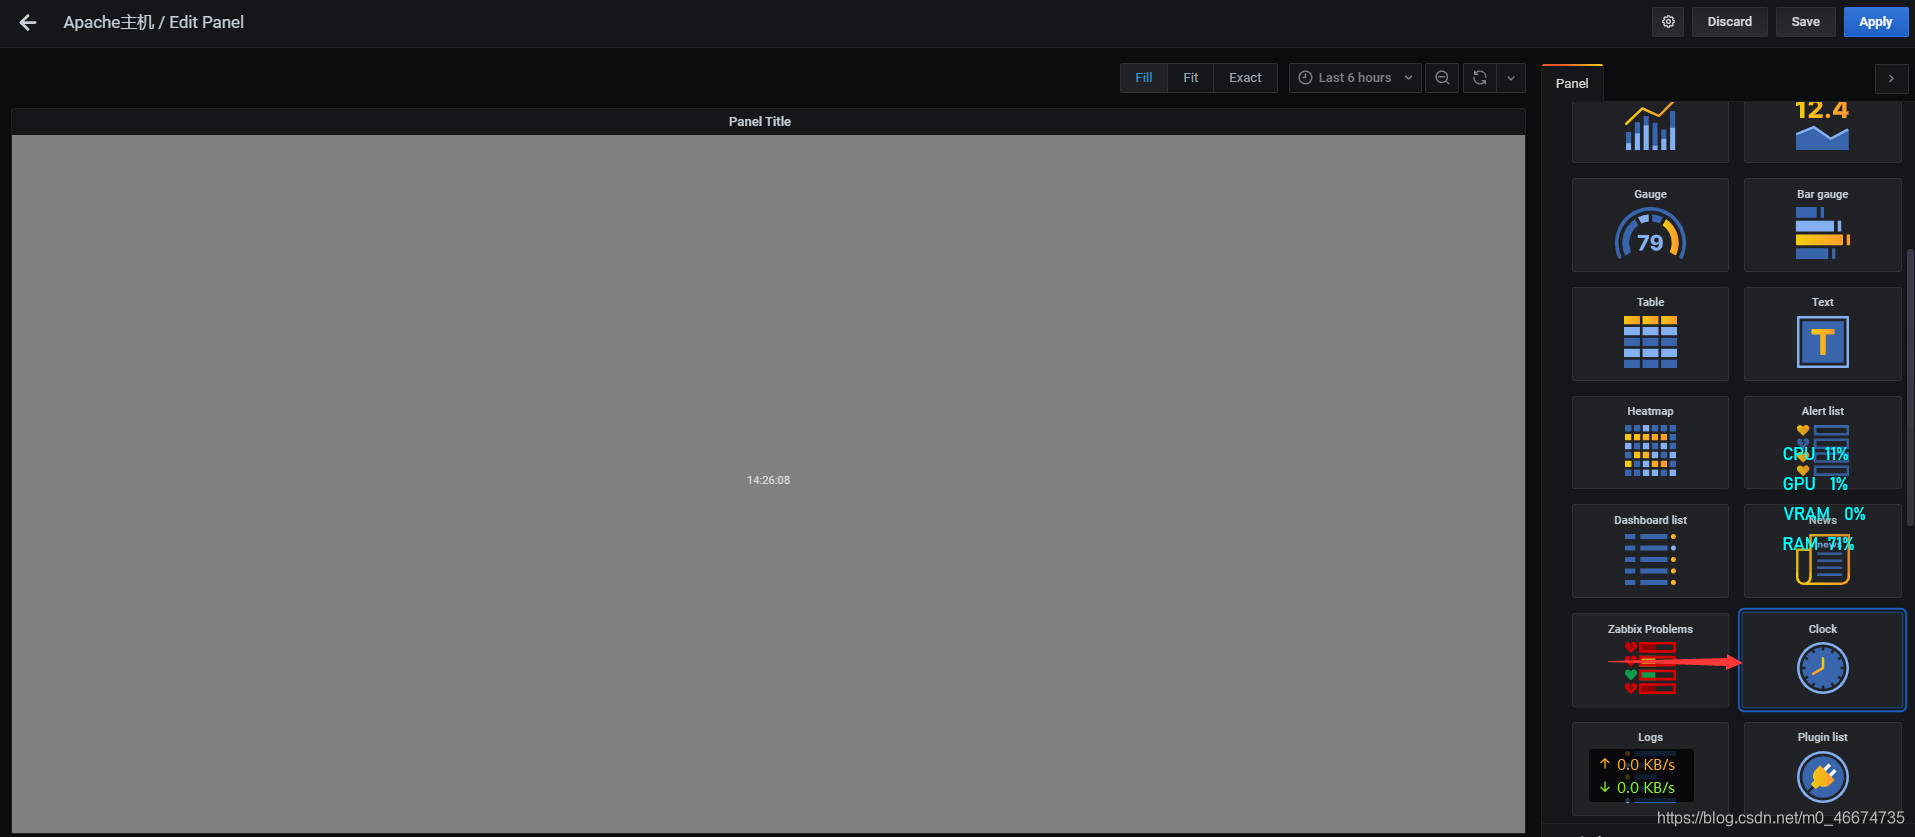
3)
4)
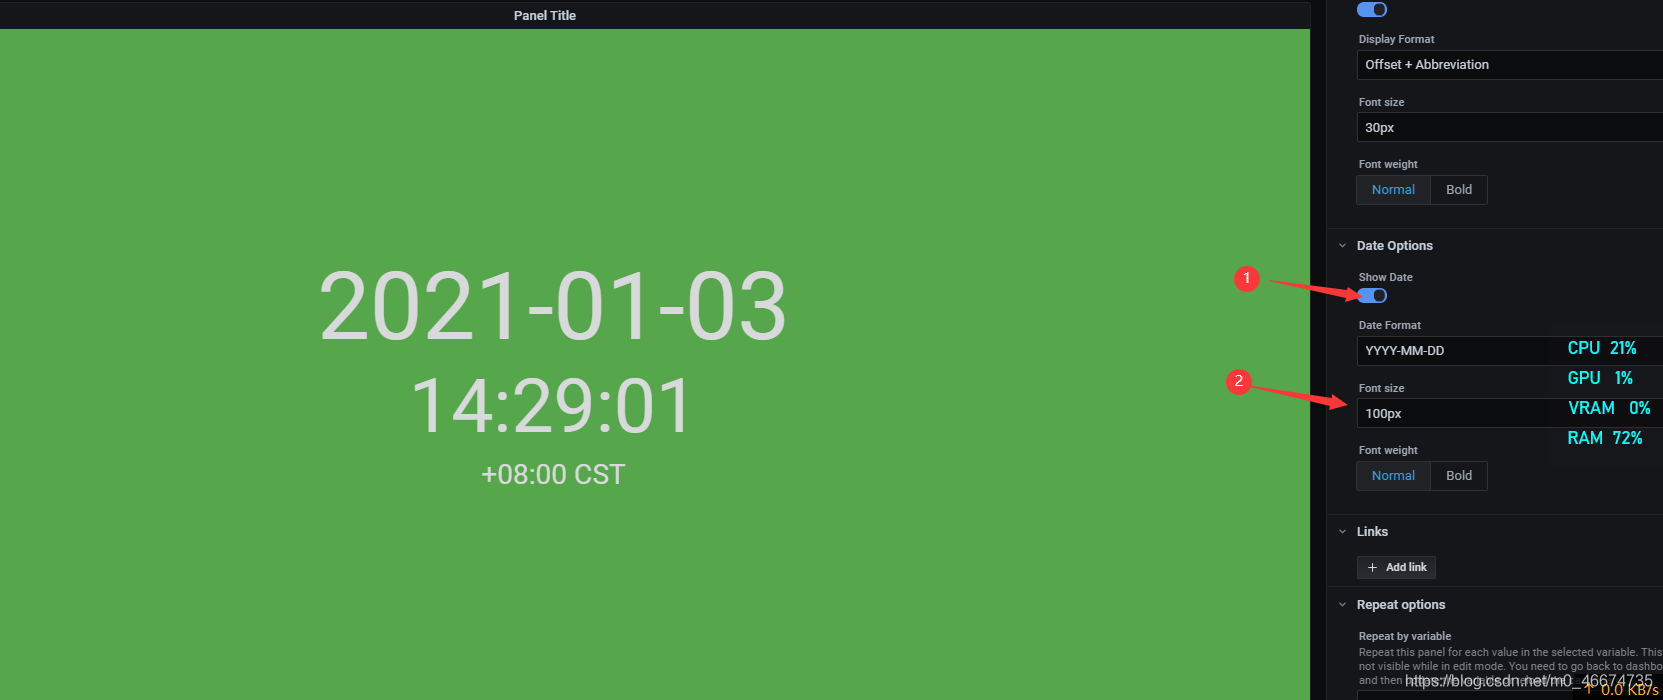
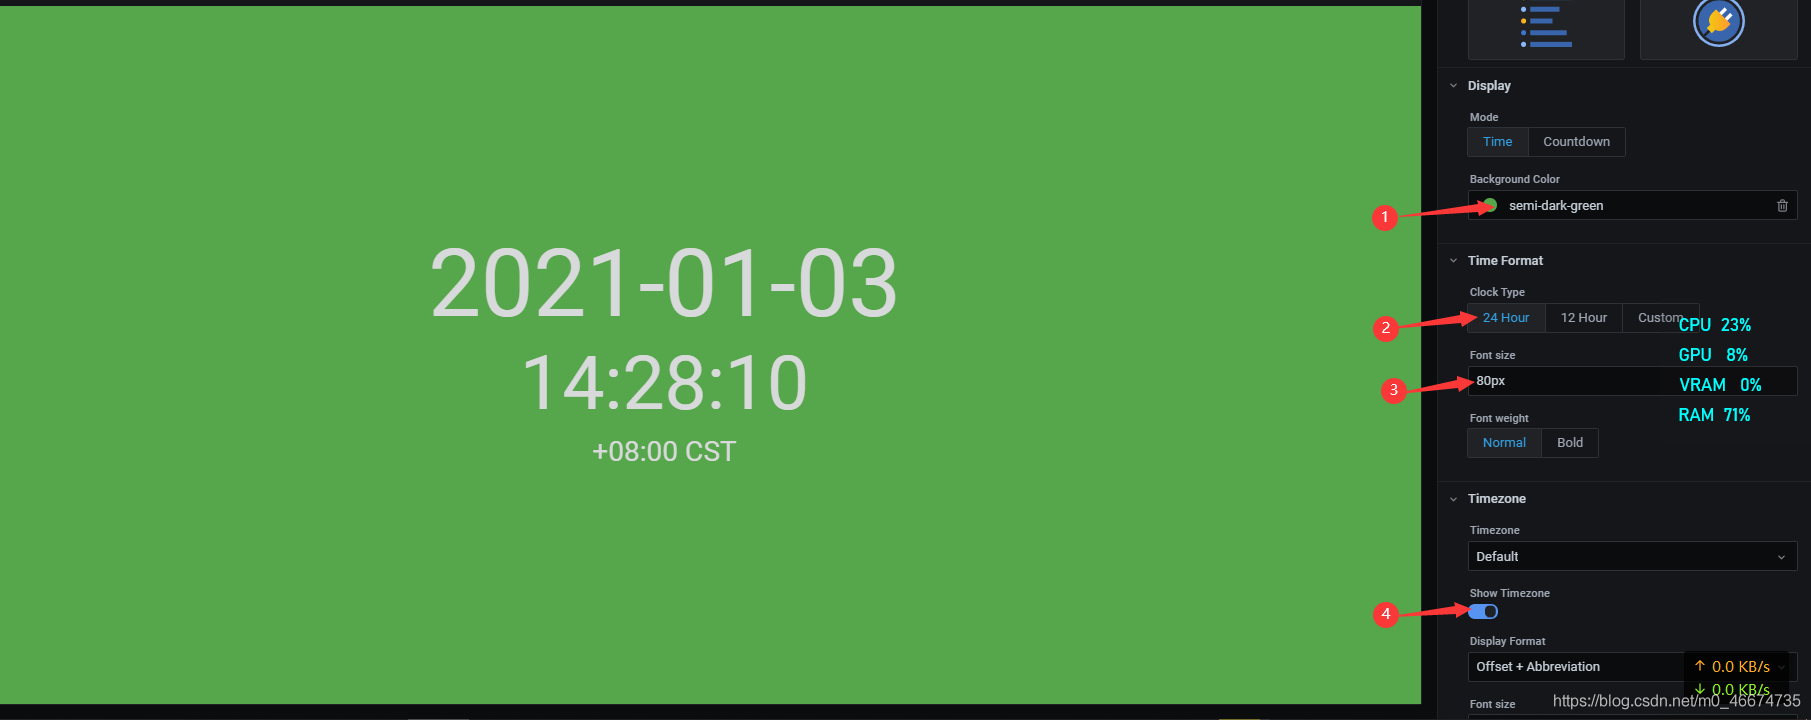
5)
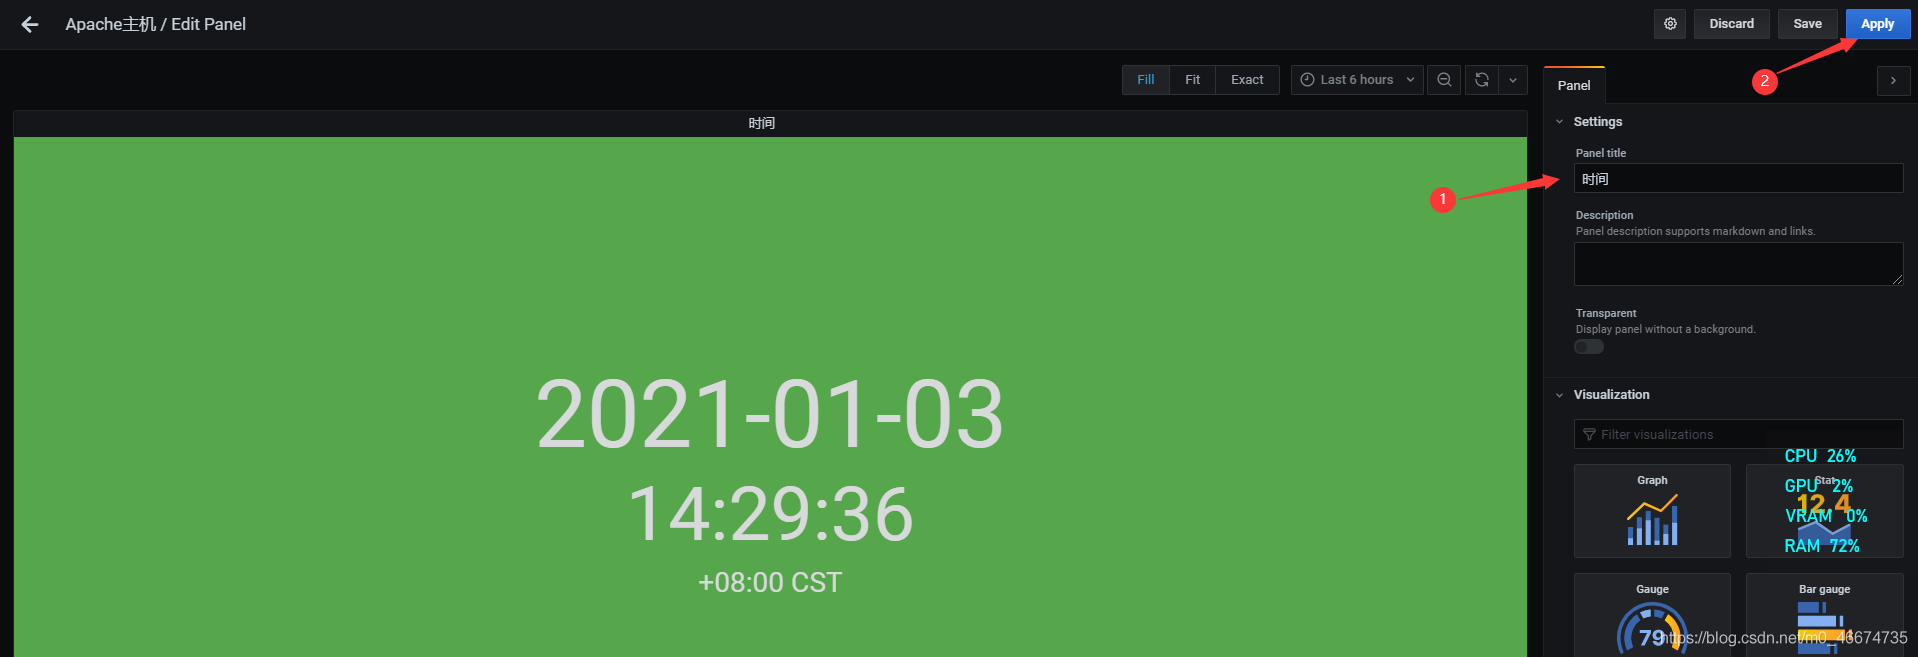
6)
到此这篇关于grafana安装及使用的文章就介绍到这了,更多相关grafana安装及使用内容请搜索脚本之家以前的文章或继续浏览下面的相关文章希望大家以后多多支持脚本之家!
您可能感兴趣的文章:- Linux下安装grafana并且添加influxdb监控的方法
- 使用Prometheus+Grafana的方法监控Springboot应用教程详解
- 使用Grafana+Prometheus监控mysql服务性能
- 使用Grafana 展示Docker容器的监控图表并设置邮件报警规则(图解)
- 在Ubuntu上使用Grafana监控Docker的方法